Research Data Integrity Tool

Role:

Sole Designer

Team:

1 Designer, 1 CPO, 5 Engineers

Timeline:

2024

Contents:

Context, Problem, Outcome, My Role, Design Decisions

Context

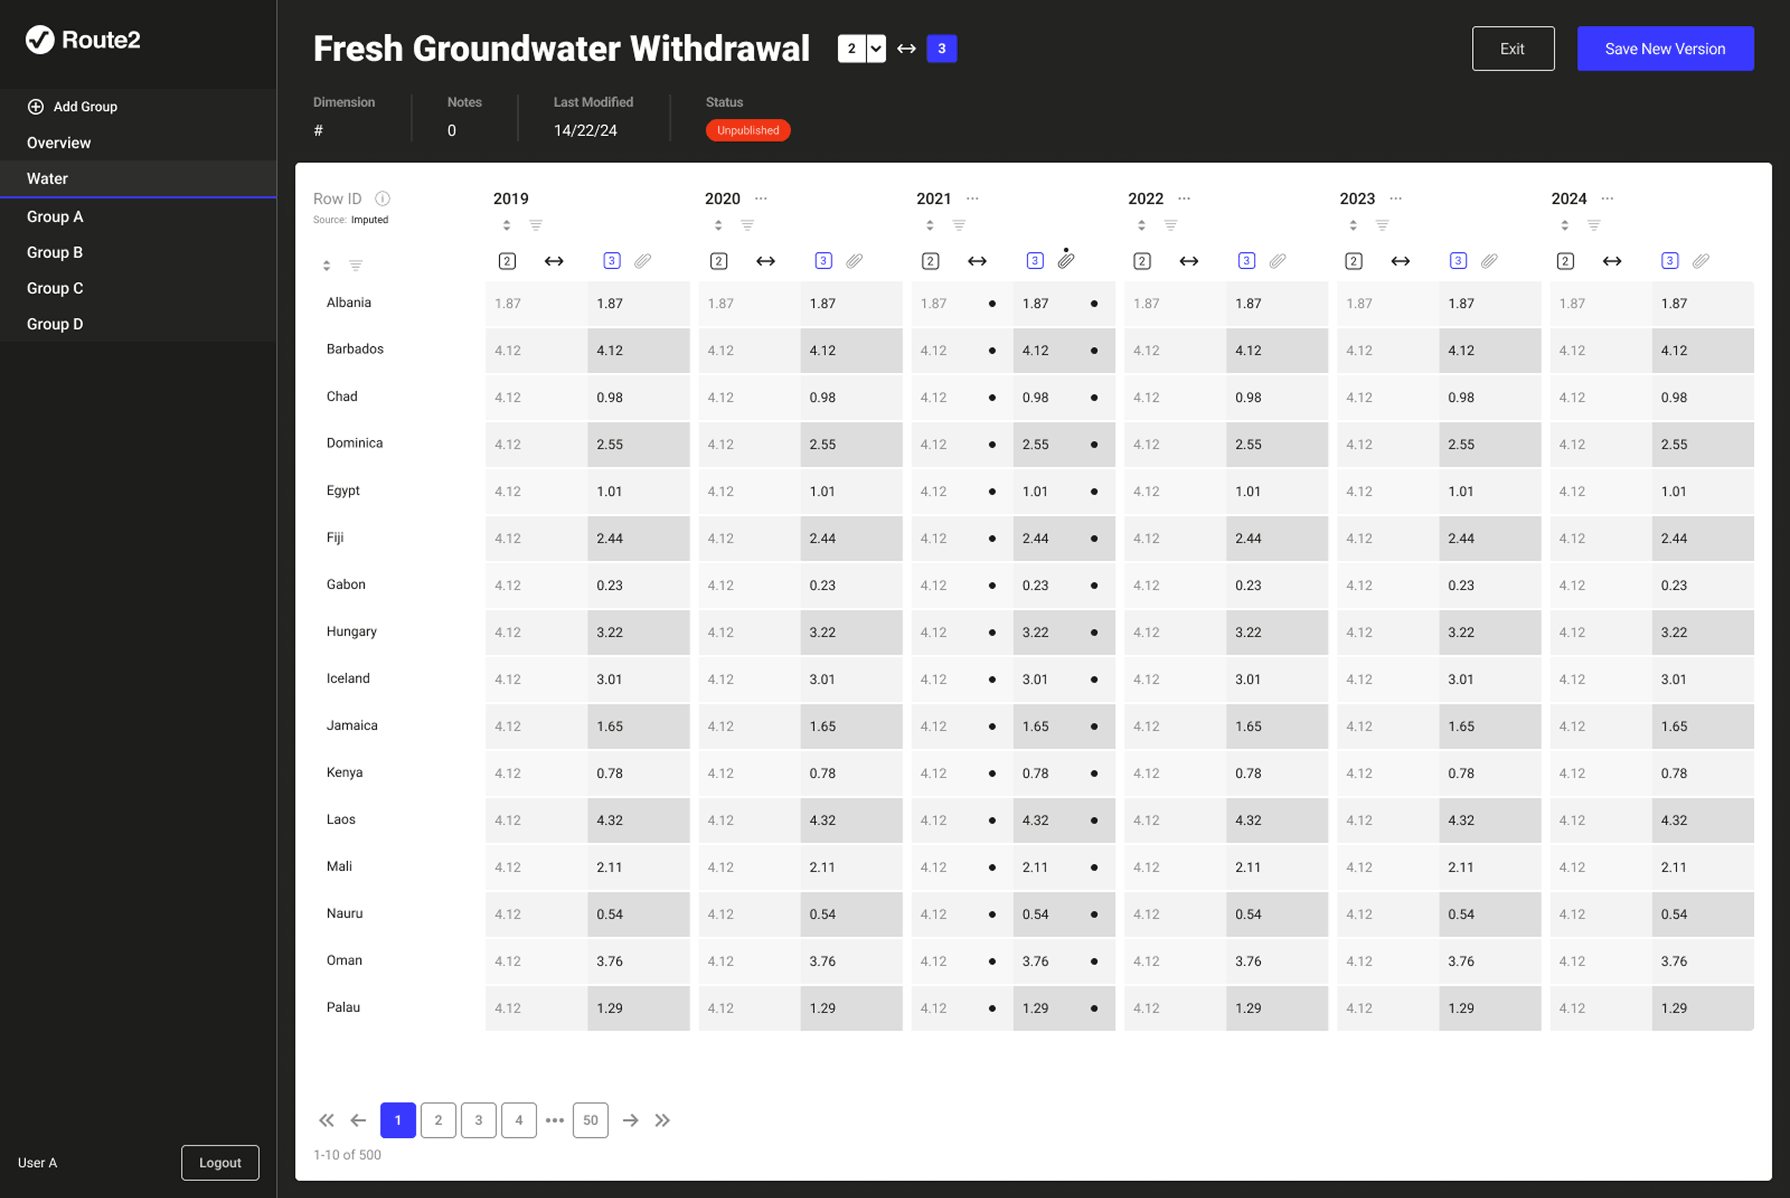
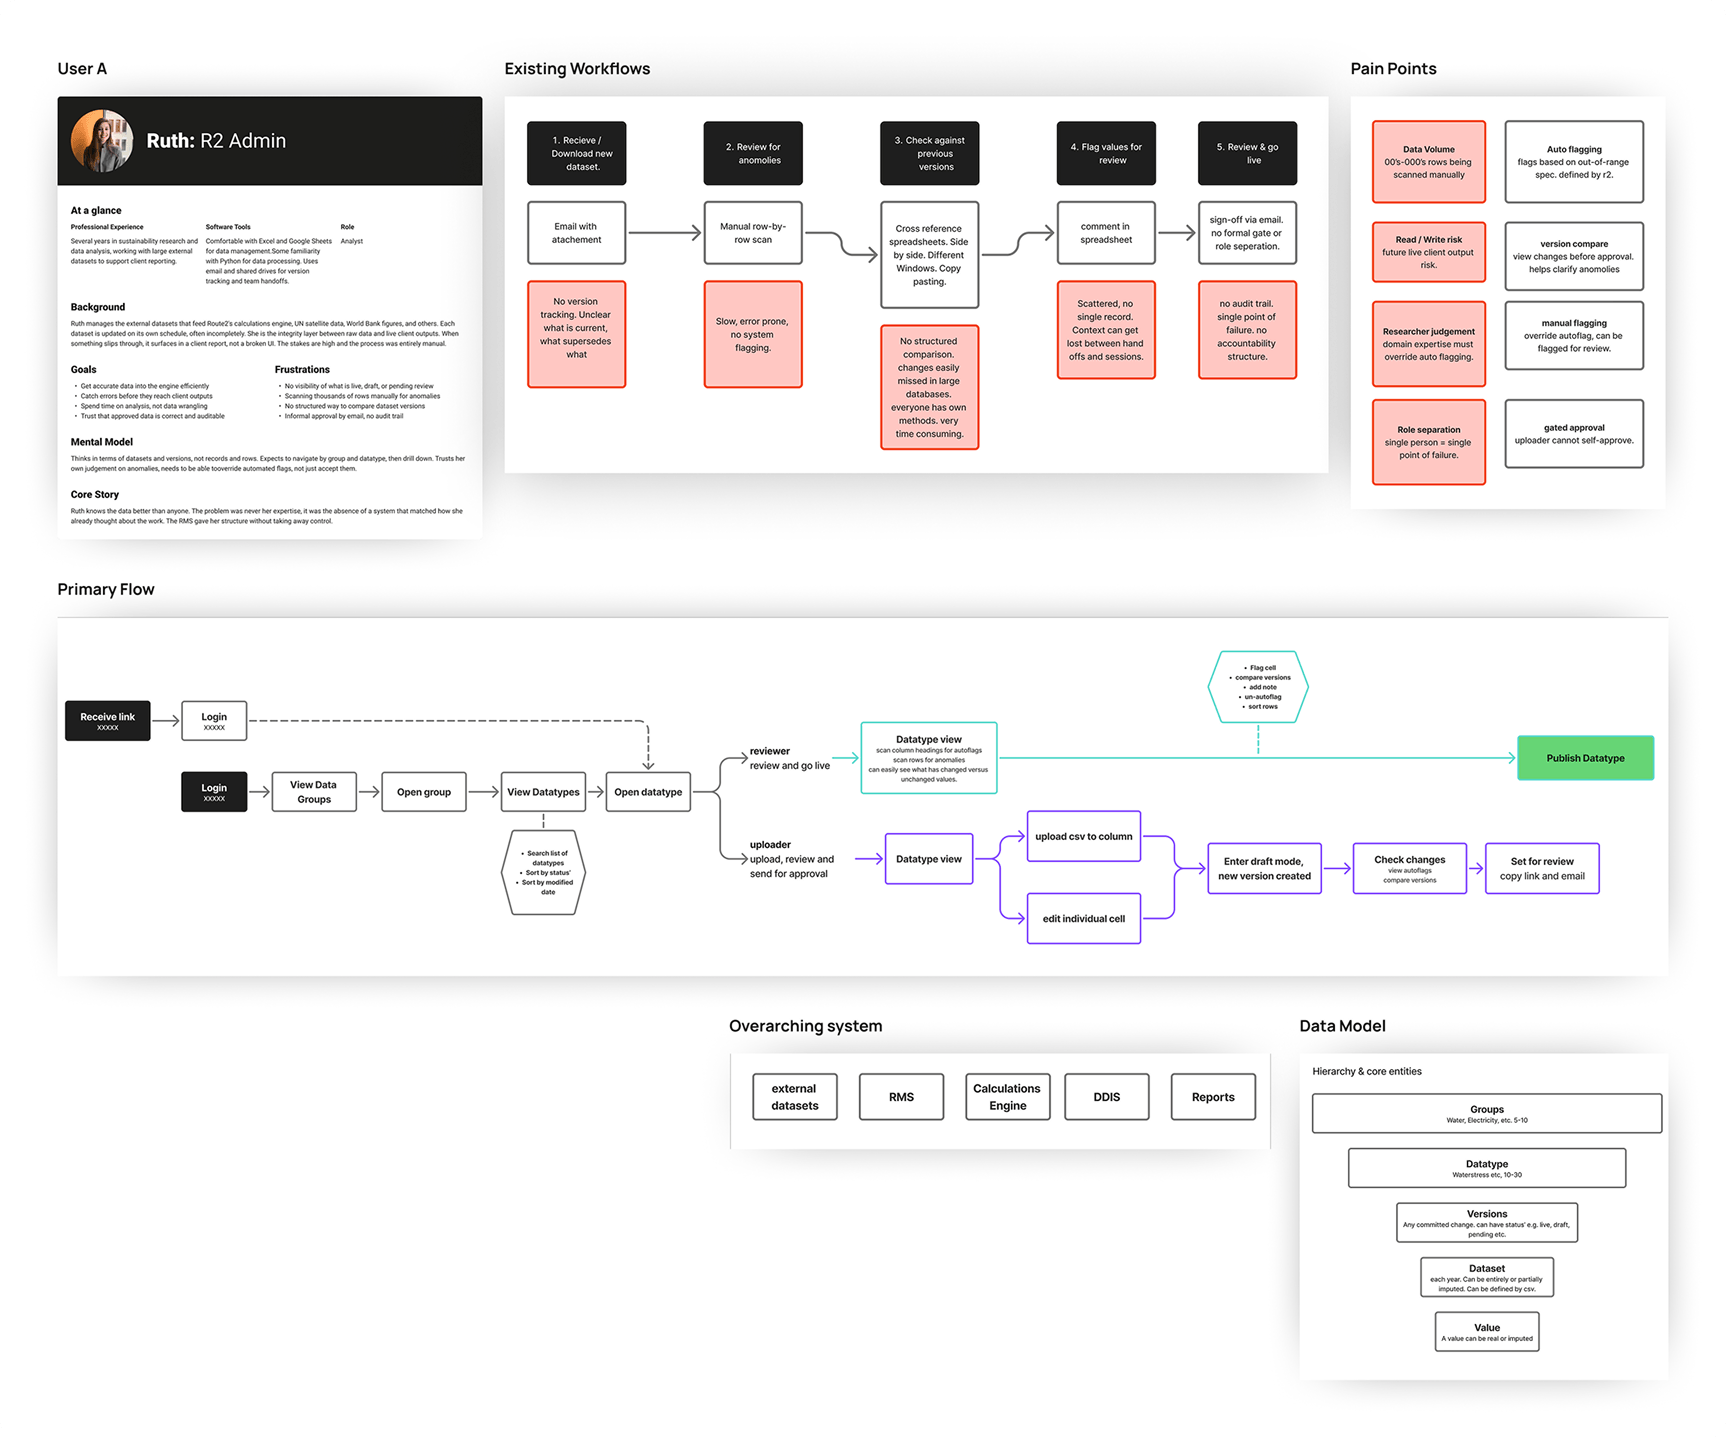
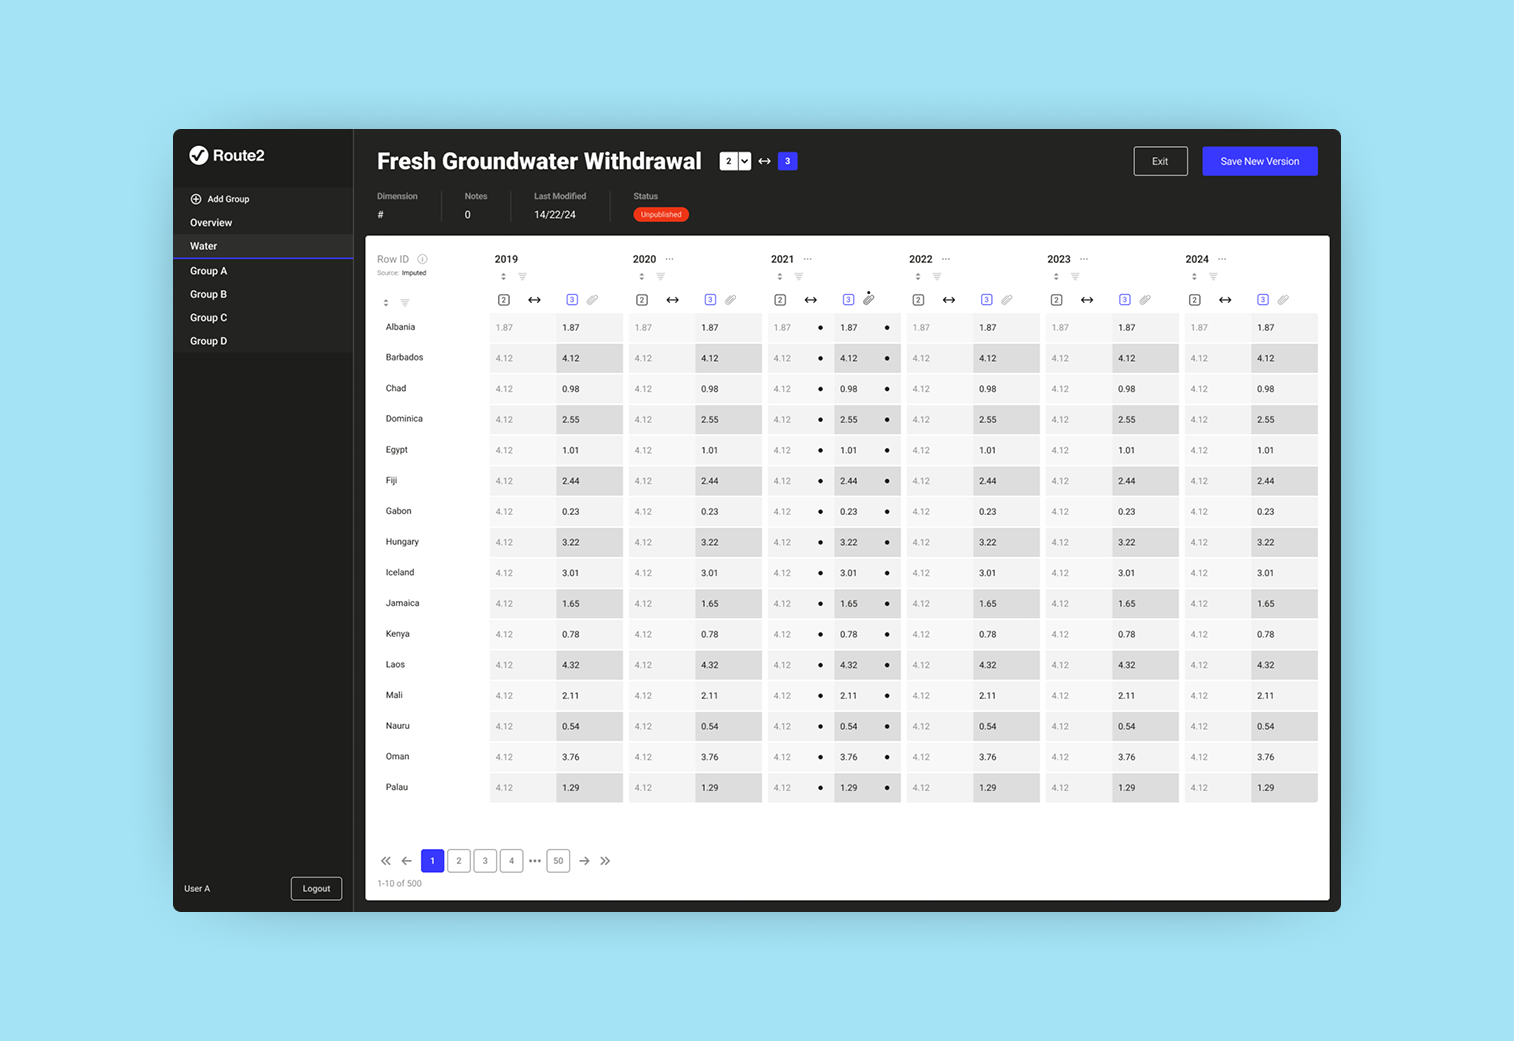
Route2 Sustainability; a consultancy built around a proprietary metric called Value2Society (V2S). The V2S output is powered by three interconnected systems: a data collection and management platform used by clients, a calculation engine that processes inputs into V2S scores, and a research management system that controls the external datasets feeding the engine. The RMS is the subject of this case study. The calculation engine is fed, via the RMS, by multiple external datasets each with their own release versions and update schedules. Researchers are the integrity layer between raw data and live calculations.

Problem

The data pipeline feeding Route2's calculation engine had no systematic visibility or control layer. Researchers were managing versioning, validation, and anomaly detection manually; tracking versions in spreadsheets, checking values by eye and correcting errors. A value could be technically valid but semantically wrong, within the right format but implausible in context. This was slow, error-prone, and consumed time that should have gone to generating insights. The consequence of getting it wrong was corrupted data in a live client report consuming further capacity to make corrections down the line.

Outcome

An internal research management system that more than doubled researcher capacity, giving the team visibility and control over every dataset feeding the live calculation engine.

No items found.

My Role

Working directly alongside researchers who had spent years managing this process manually meant the pain points were observable and specific. What broke down, where inconsistencies crept in, which checks were being missed.
Five needs surfaced consistently 1) visibility over what datasets were live and in what state, 2) trust signals distinguishing real values from imputed ones, 3) control over uploading and approving versions without risk to live calculations, 4) anomaly detection that surfaced problems before they reached client reports, 5) and navigation that let researchers move efficiently between datasets without losing context. The main design challenge was framed around anomaly detection, because solving it naturally pulled in every other need. Key research elements included; R2 persona created, existing workflow mapping, pain point analysis, system architecture & data model, and user flows. The researcher persona was defined around the two key actions in the workflow: uploading data and approving/publishing data. Flows and wireframes were validated with the CPO and engineering team before moving into high-fidelity designs and an interactive prototype in Figma.

Design Decision: Data Table and Cell Indicators

External datasets contain thousands of rows. The interface needed to surface anomalies without requiring researchers to manually scan everything. The solution was a visual language for cell states: filled circles for real values with an attached source file, and red flags for detected anomalies. Researchers scan rather than read. Colour and shape do the work before conscious attention. Some years have actual files attached, others are entirely or partially imputed. Making that distinction visible at a glance, without requiring a click into every cell, was the core of the decision.

Version Comparison

The calculation engine was live and serving client outputs. Any tool that could modify what the engine was reading carried inherent risk. A researcher accidentally approving the wrong version could affect live client reports. The solution was a side-by-side split view. When a new version of a dataset is created, the researcher sees exactly what will change before anything goes live. Each column splits into two, showing values from each version. Discrepancies are immediately visible without manual scanning. Every change creates a new version, nothing is overwritten, history is always accessible.

The Overview

Early designs were organised around progress and datatype status, showing completion rates and how many datatypes had gone live. Through working with researchers it became clear that progress tracking was a secondary need, only relevant during onboarding. The primary daily need was getting to the right datatype quickly. The overview was redesigned from a status dashboard to a navigation-first view, cards organised by group, surfacing the three most recently modified datatypes per group. An earlier version of the datatype screen also included a chart visualisation showing trends over time. It had genuine functional value for spotting anomalies across a long time range. It was removed. In a tool where speed and precision mattered more than trend analysis, it added cognitive overhead without sufficient return as the autoflagging system would be surfacing spikes clearly.

Other Projects